
Telemetry destinations
Send the numbers Searchability already records about your search into your own monitoring tools — Datadog, Grafana, Honeycomb, New Relic or anything that accepts OpenTelemetry (OTLP).
- A continuous stream of metrics, traces and logs; a webhook is one event at a time.
- Auth headers are the only secret. Encrypted when stored, never shown again. Custom destinations can have none.
- Found under Insights → Telemetry.
Stream telemetry to your stack
A telemetry destination sends your search metrics, traces and logs to your own monitoring tool over OpenTelemetry (OTLP). Find it under Insights → Telemetry.
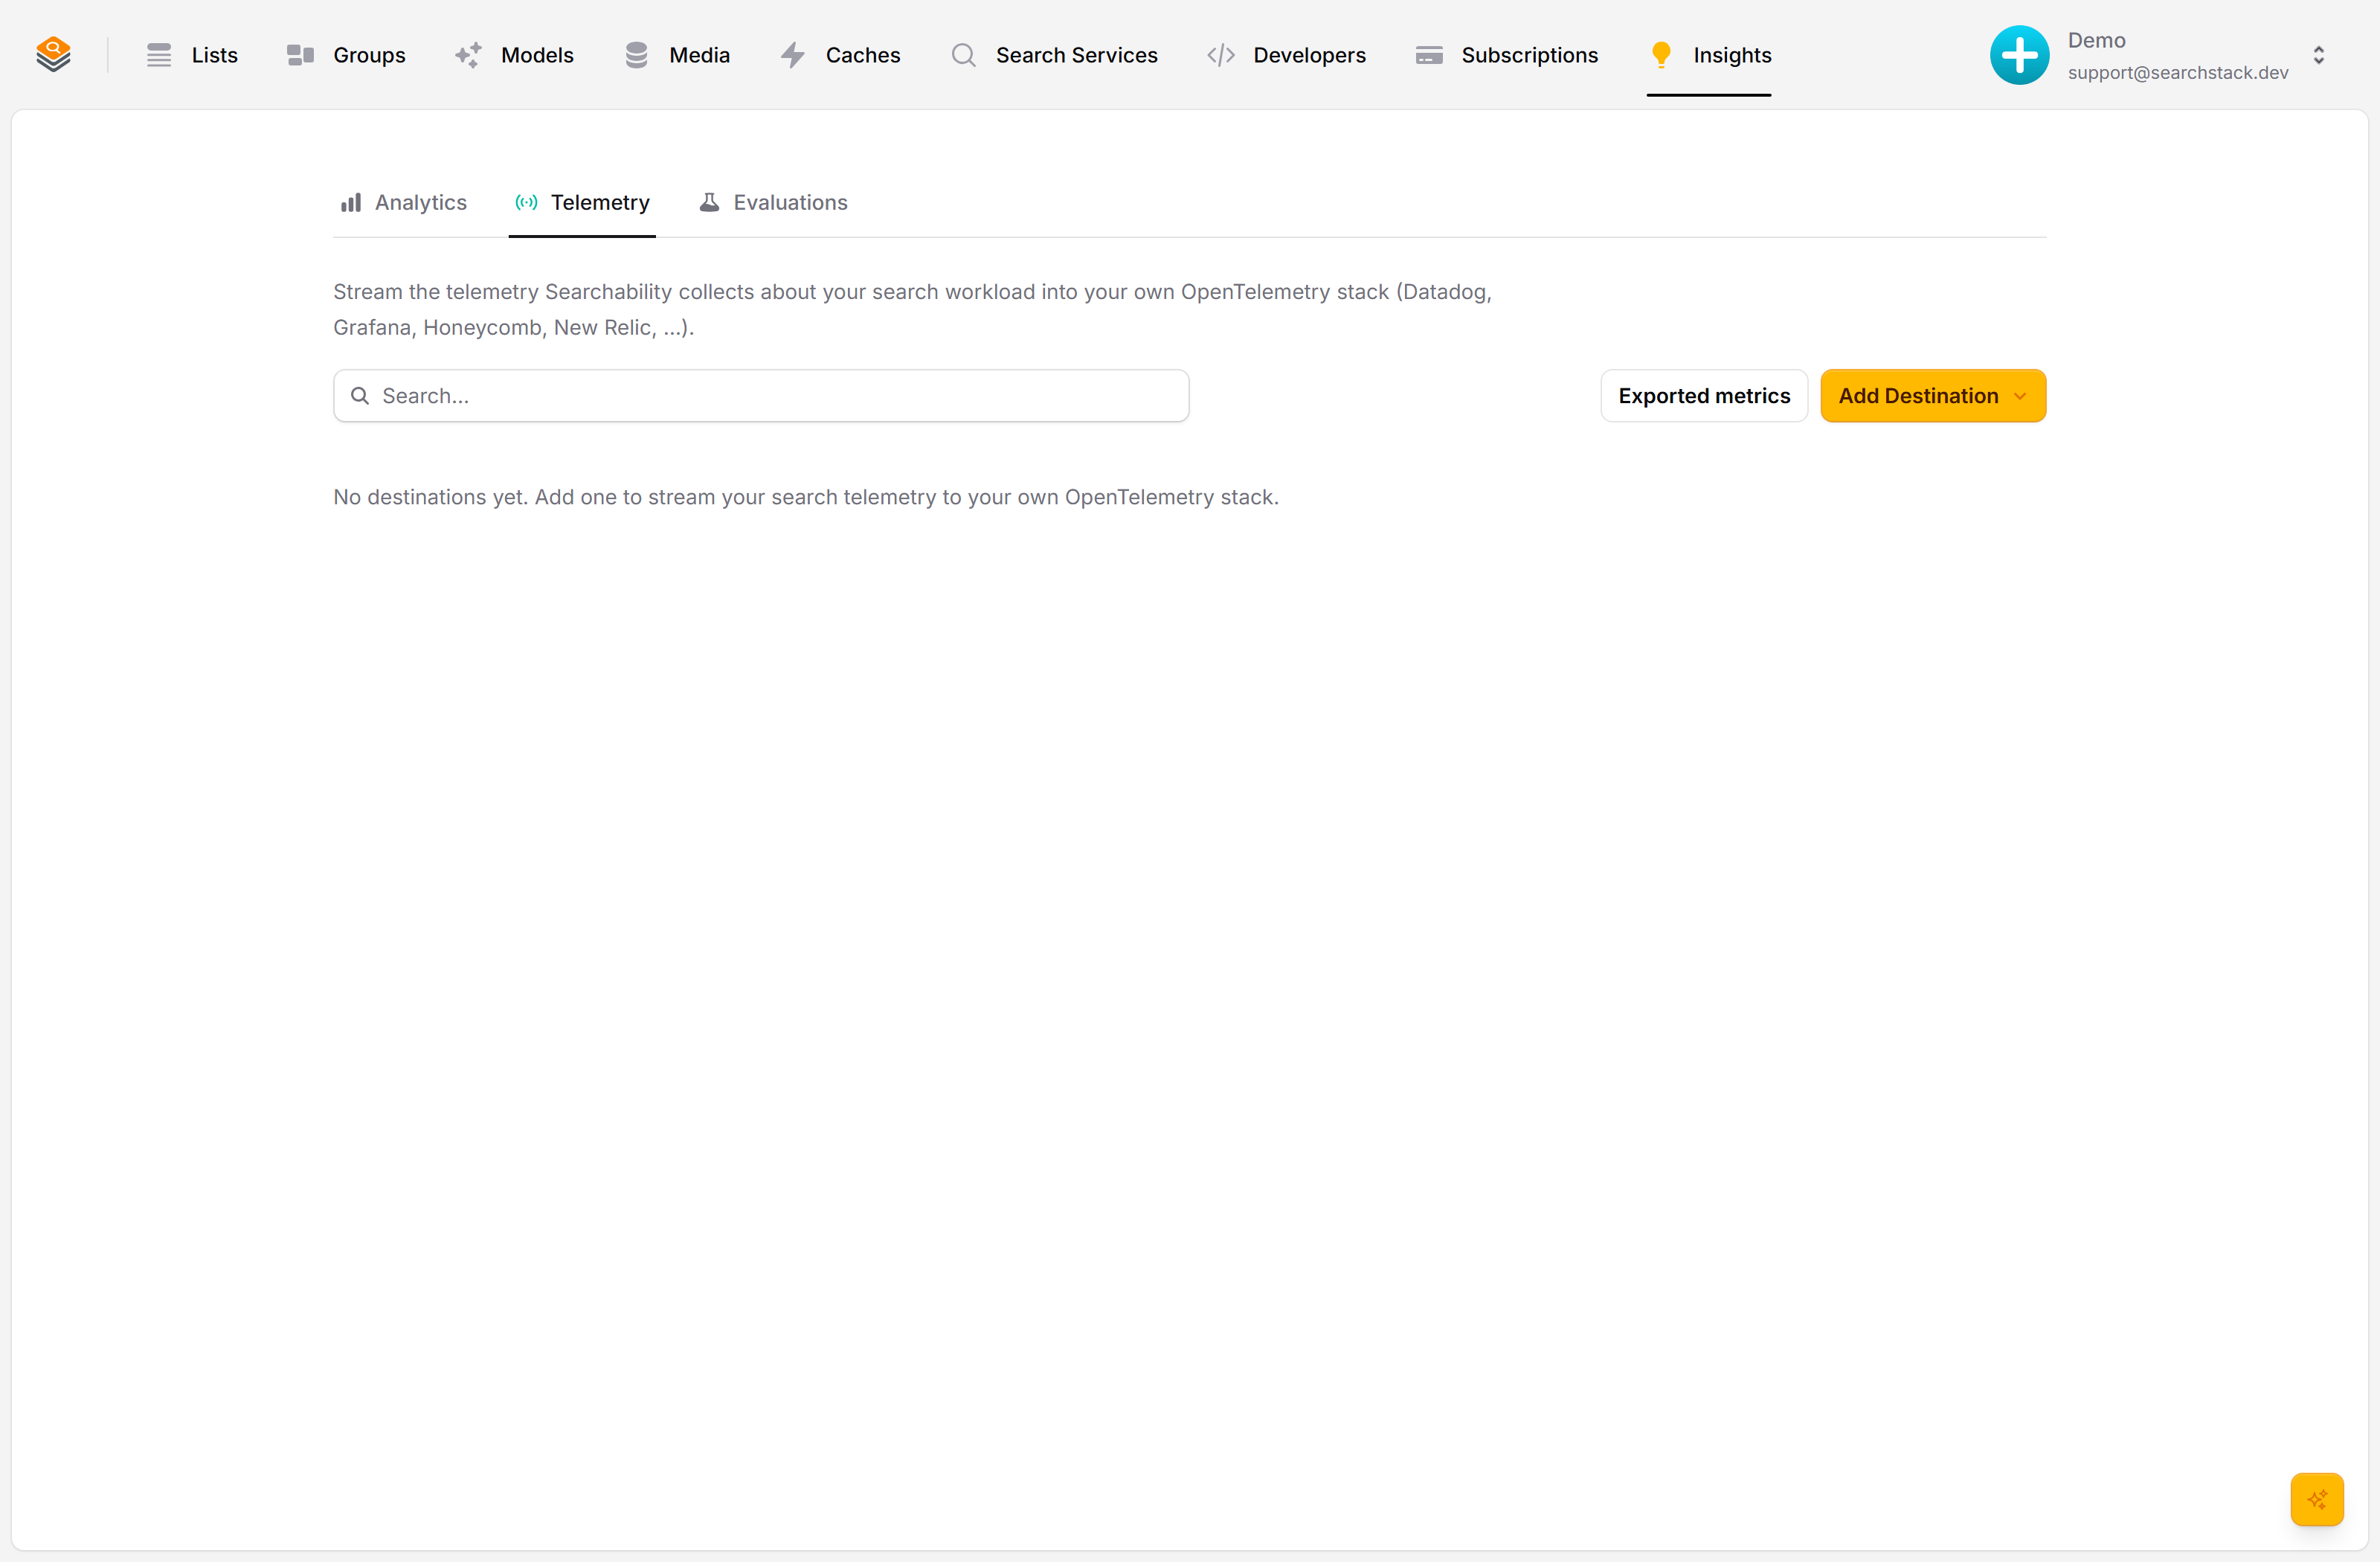
Endpoint, auth header, signals
Click Add Destination, pick your provider (or Custom), and fill in the endpoint and an auth header for your key — kept encrypted, never shown again. Under Advanced: the OTLP transport (HTTP or gRPC) and the signals (traces, metrics, logs), all three ticked by default.
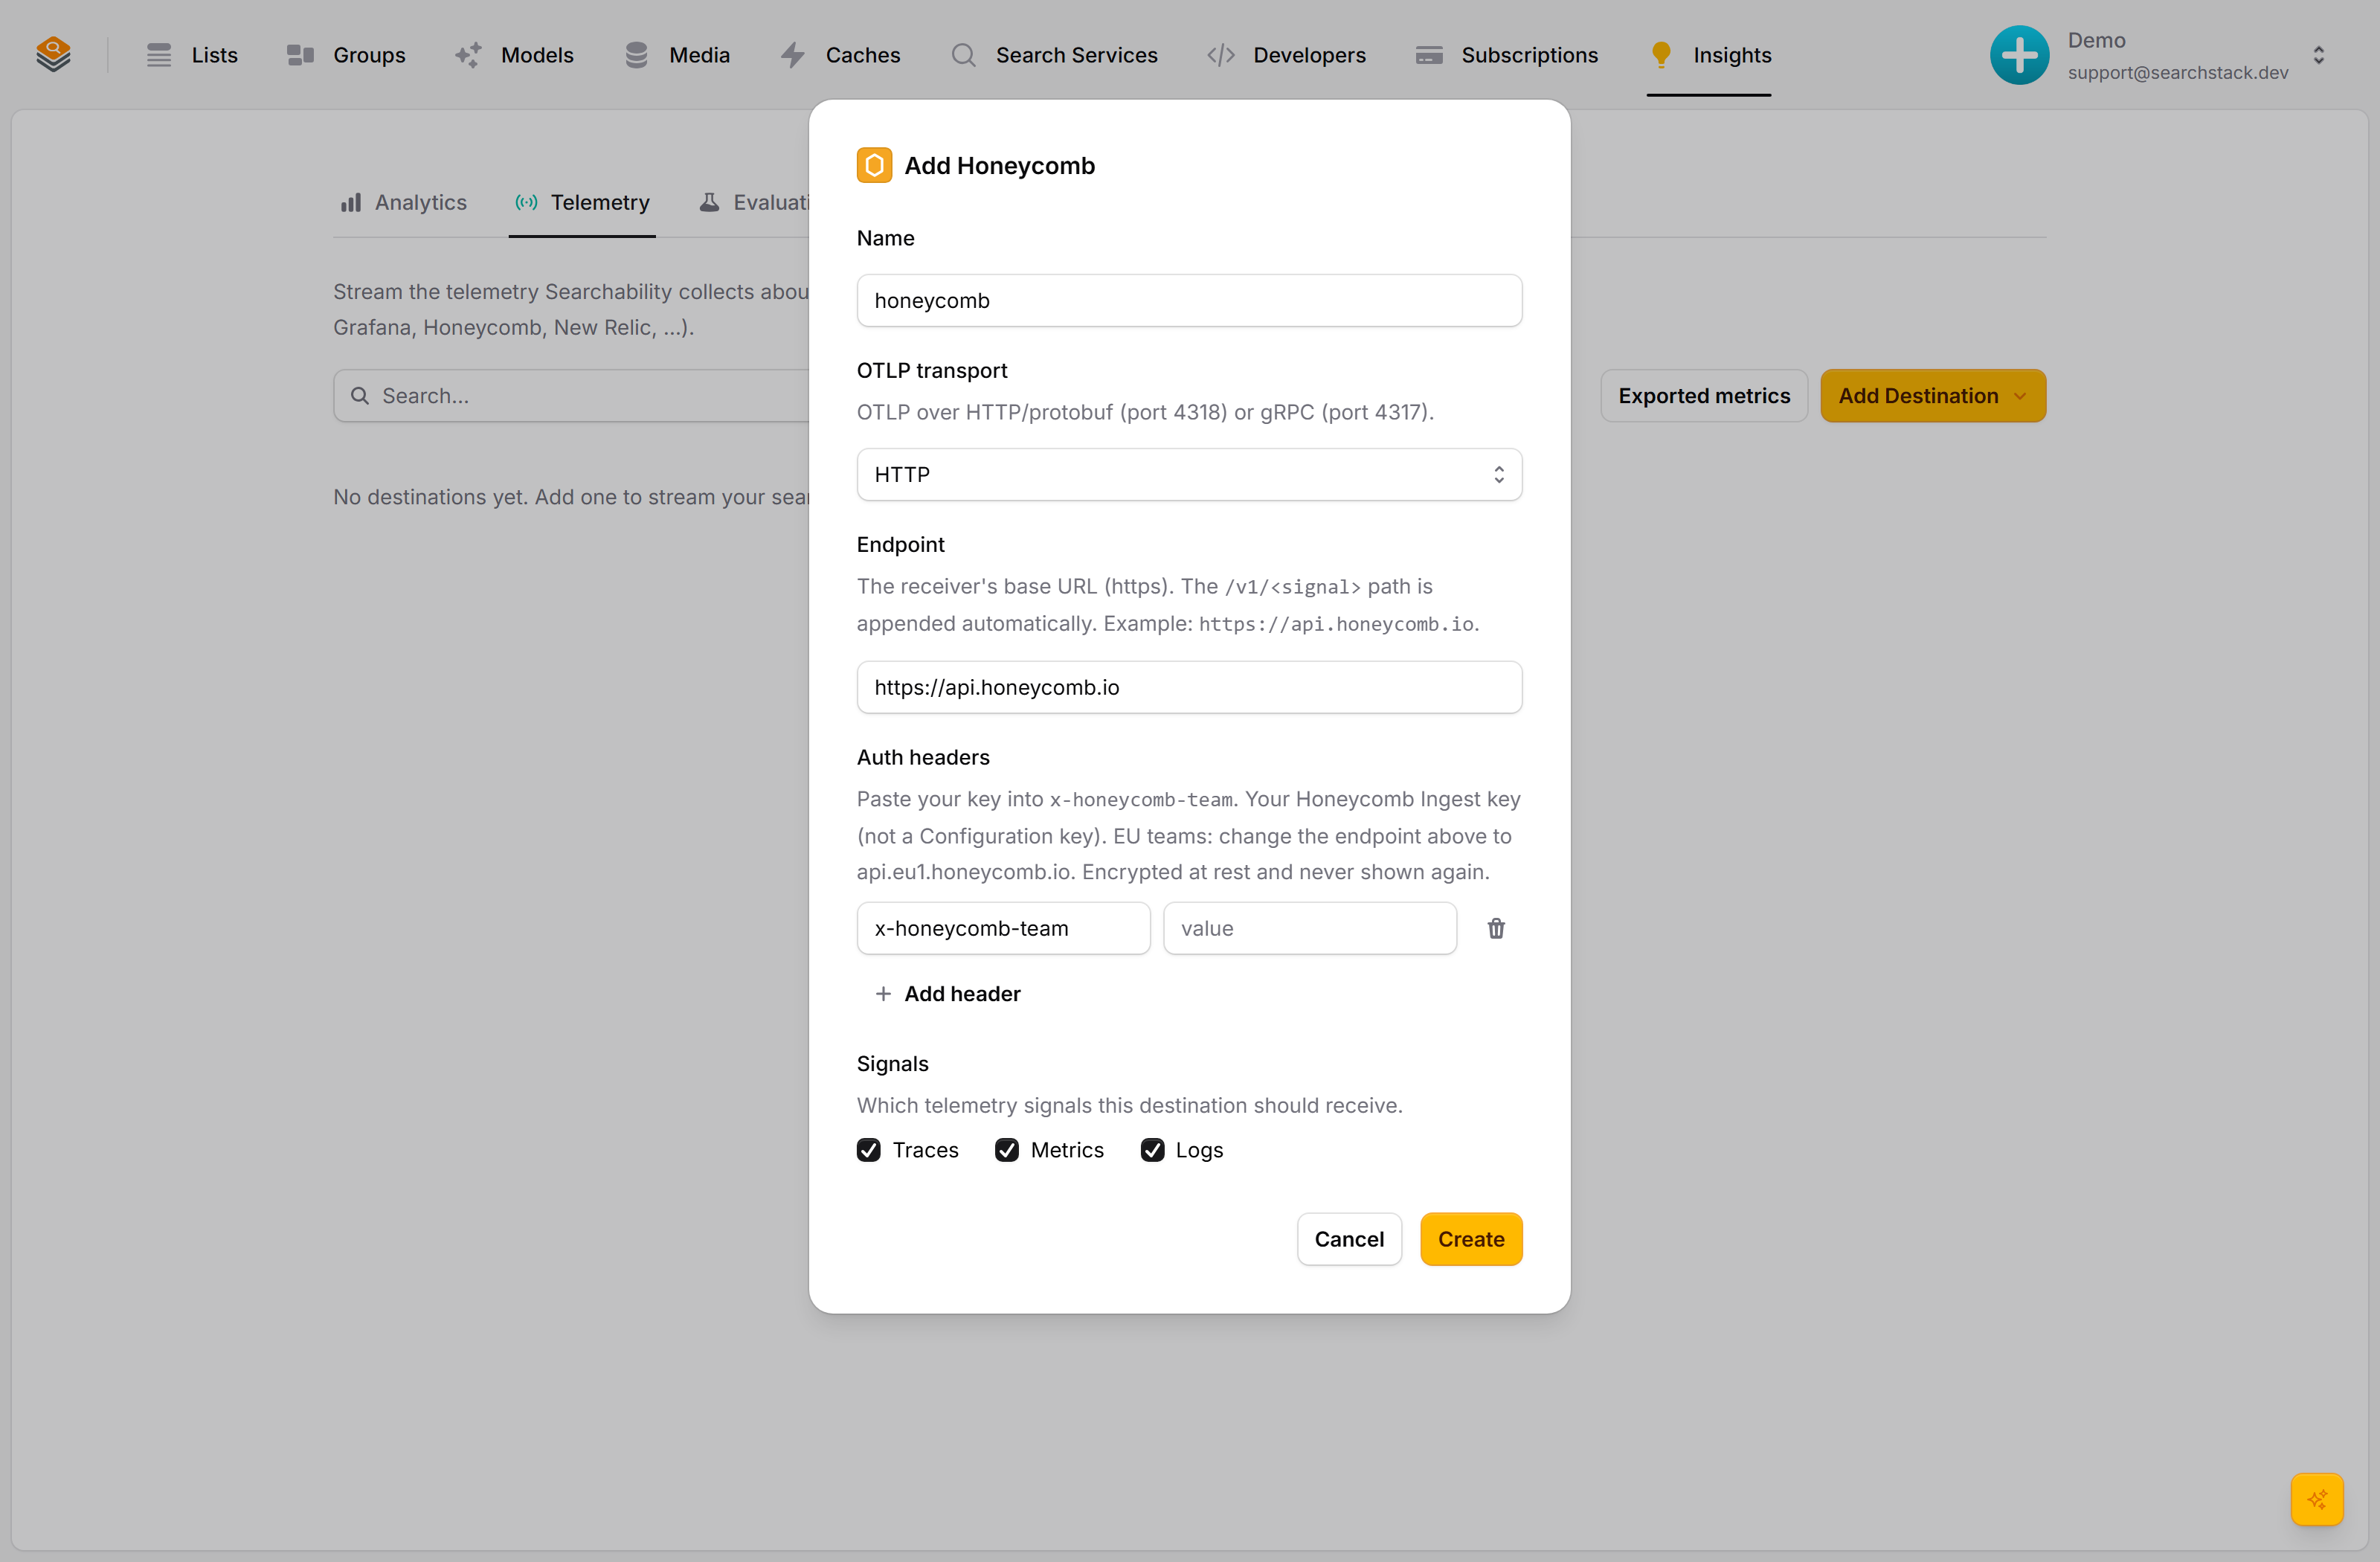
Search-quality metrics, tagged
With metrics on, every instrument in Exported metrics reaches your backend, tagged with your account. Download starter dashboard gives you a ready-made one.
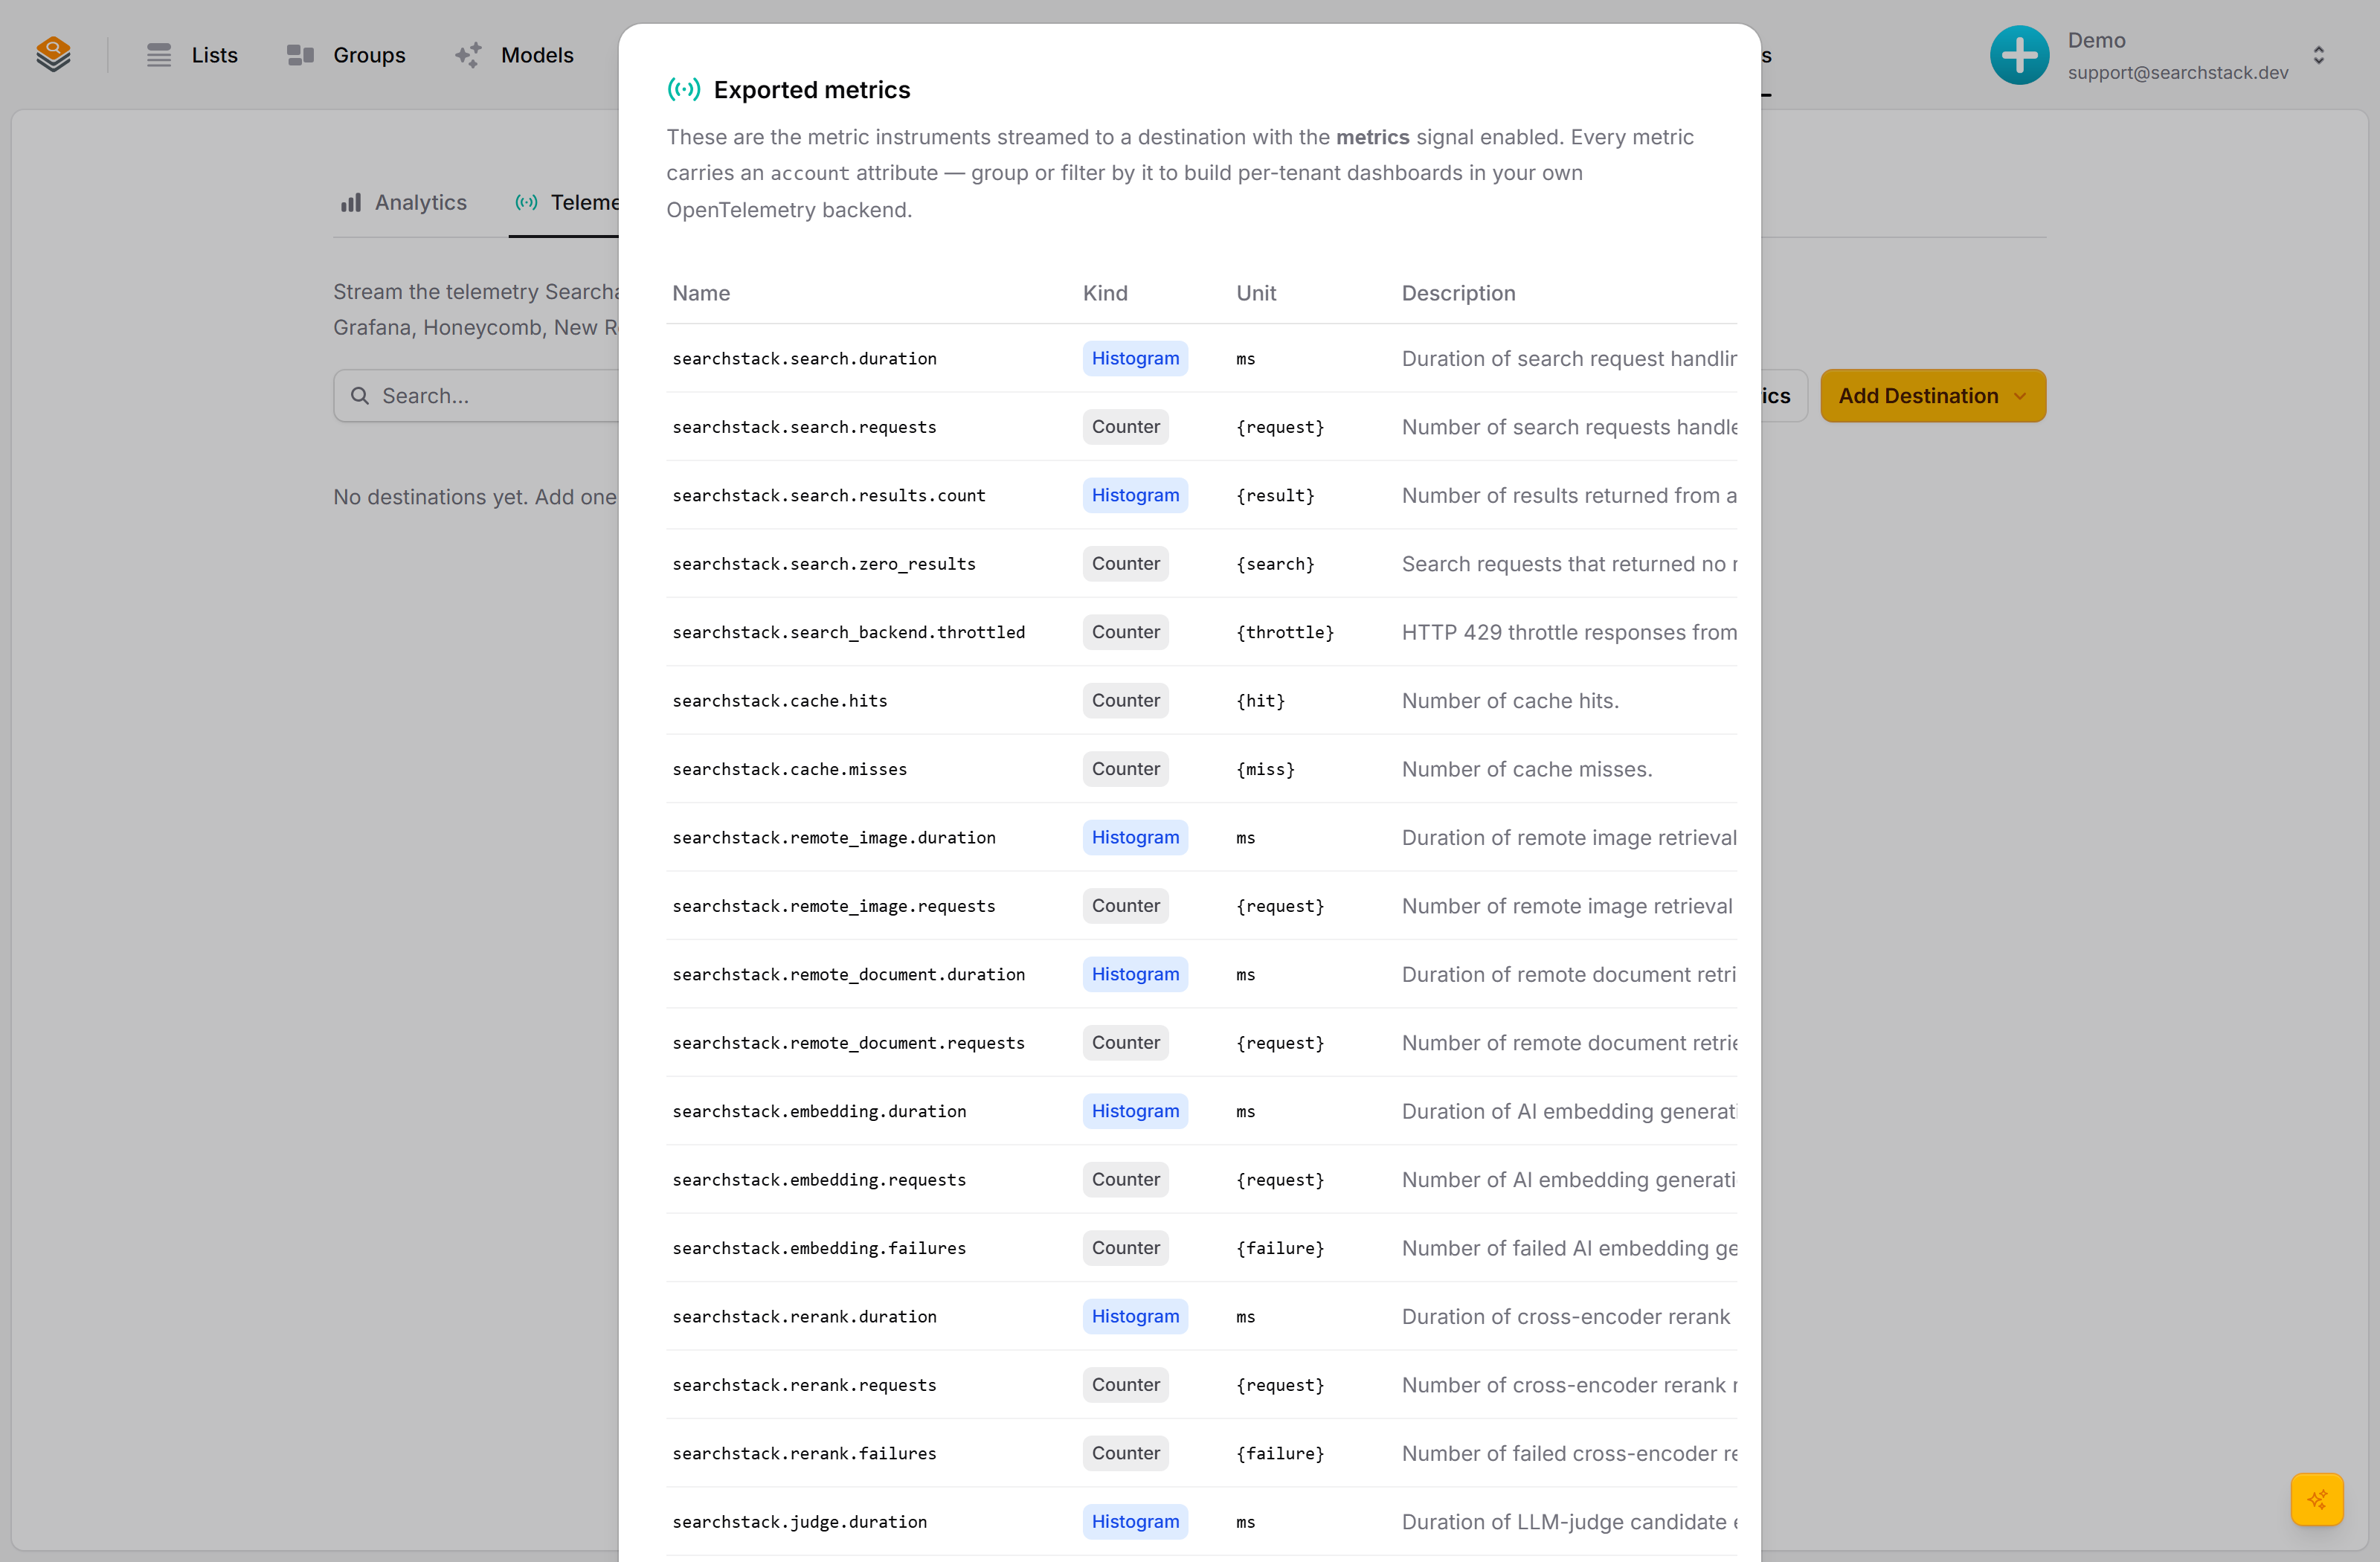
Add a destination
- Insights → Telemetry → Add Destination. Pick a provider (Grafana Cloud, Honeycomb, New Relic), which fills in the header name and, except Grafana Cloud, the endpoint. Or pick Custom for any other OTLP endpoint.
- Give it a Name: letters, numbers and single hyphens, stored lower-case. It cannot be changed later.
- Set the endpoint. HTTP (port 4318): the base URL —
/v1/<signal>is added for you. gRPC (port 4317): host and port, no path. The transport is under Advanced and cannot be changed later. - Paste your key into the auth header (required for a provider; optional for Custom). Add more headers if your backend needs them.
- Signals (under Advanced) default to traces, metrics and logs; untick any you don’t want, but keep at least one. Click Create.
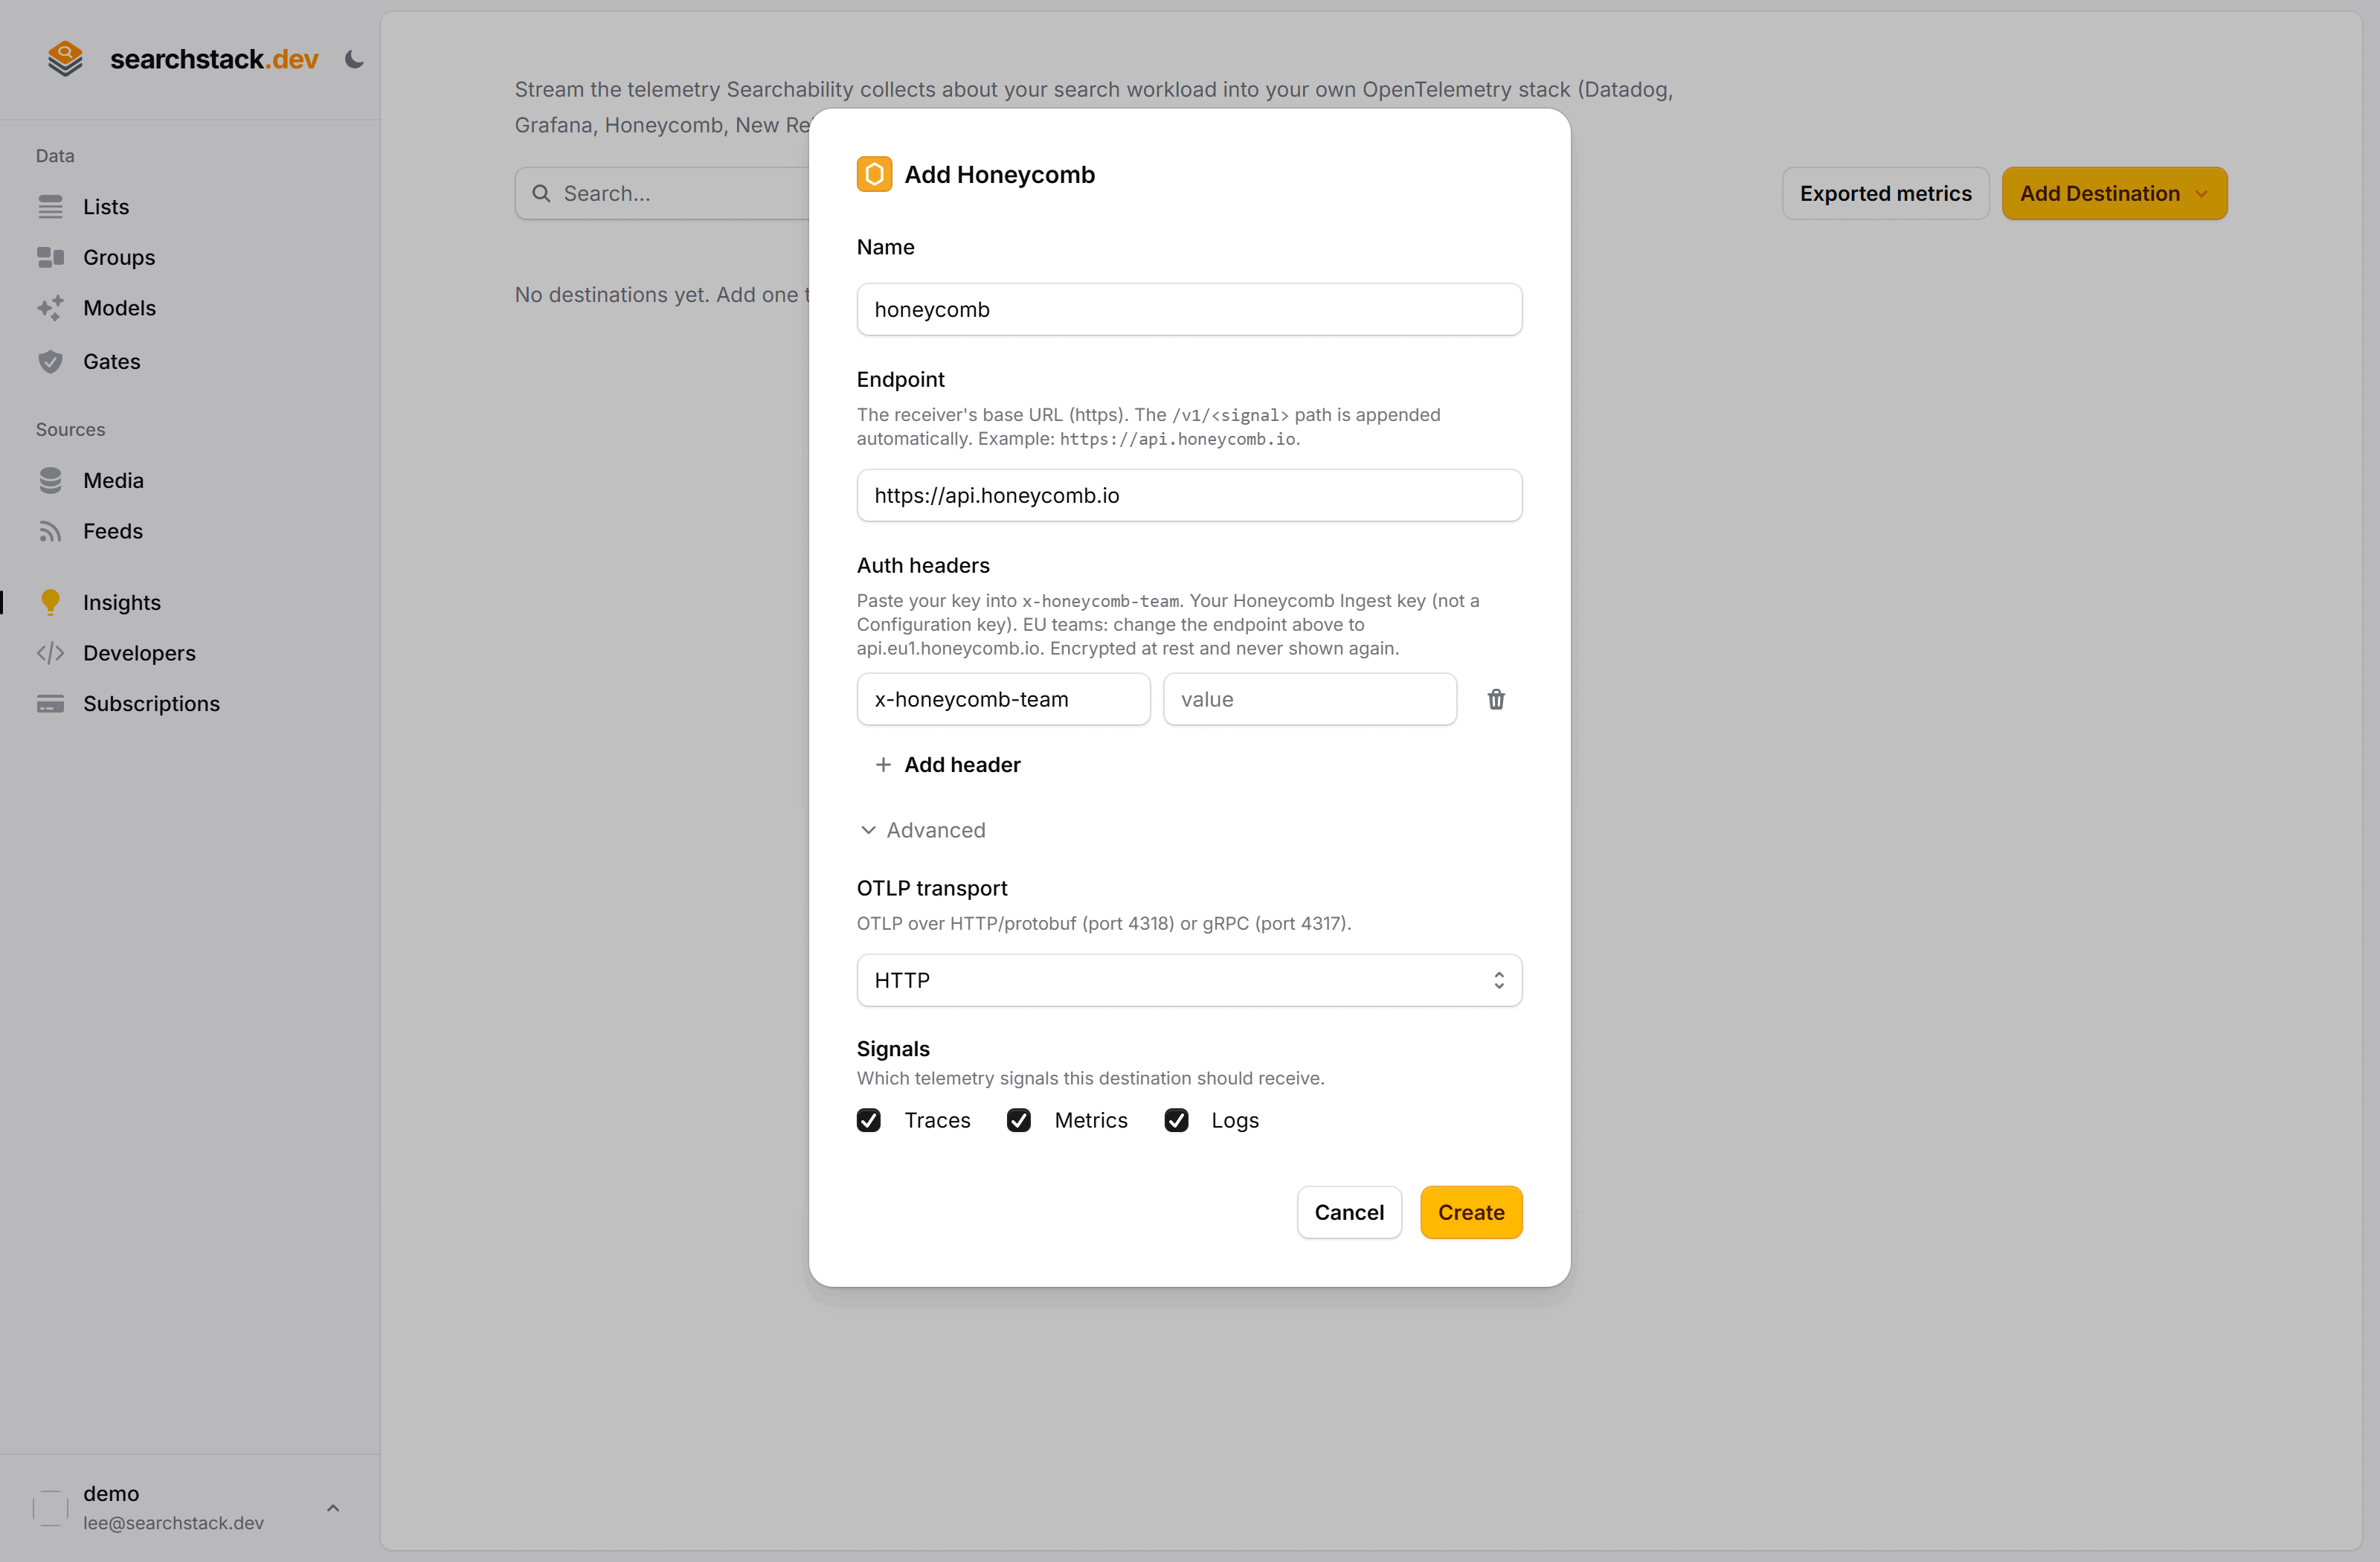
Providers
| Provider | Endpoint | Auth header |
|---|---|---|
| Honeycomb | https://api.honeycomb.io (EU: https://api.eu1.honeycomb.io) | x-honeycomb-team: your Ingest key |
| New Relic | https://otlp.nr-data.net (EU: https://otlp.eu01.nr-data.net) | api-key: your license key |
| Grafana Cloud | https://otlp-gateway-<zone>.grafana.net/otlp (from your stack) | Authorization: Basic base64(instanceID:token); Basic is added if you paste the bare token |
| Datadog | Custom, with your Datadog OTLP intake URL. Untick metrics under Advanced: Datadog accepts only delta metrics and SearchStack sends cumulative | dd-api-key: your API key |
Endpoint and header rules
- https only. No internal, loopback or link-local addresses.
- Transport (
protocol):otlp_grpcorotlp_http, in any case. Any other value is refused with a message naming both. - No credentials, query string or fragment in the URL — put secrets in a header.
- Header names must be valid HTTP header names, used once each. Values cannot be empty or contain control characters (line breaks included); surrounding spaces are trimmed.
- Values must be plain ASCII: no accented letters or curly quotes.
- gRPC: header names may only contain letters, digits,
.,_and-. - Refused names:
Host,TE,Connection,Transfer-Encoding, and any startingcontent-,grpc-or:, or ending-bin. - Editing a destination: re-enter each header (name and value); only a provider’s header name is filled in. Leaving every value blank removes all headers.
The save-time check
Create and Edit send one empty export and refuse the save if it fails.
- HTTP: sent to the first selected signal's path —
/v1/traces, else/v1/metrics, else/v1/logs. - gRPC: calls
Exporton the first selected signal's service, in the same order.Unimplementedfails only when that service is missing. - gRPC answered with a non-200 HTTP status (a proxy or web server): judged by the HTTP rules below, except 429 passes and 400, 404, 413 or 415 fail as not a gRPC receiver.
| Passes | Fails |
|---|---|
| HTTP 2xx, 400, 413, 415, 429 | HTTP 401/403 (headers rejected), 404 (wrong path), 3xx, any other 4xx or 5xx |
| Any other gRPC status; a proxy’s HTTP 429 | gRPC Unauthenticated, PermissionDenied, Unavailable, DeadlineExceeded, Cancelled, Unimplemented; an answer that is not gRPC |
| The TLS handshake failed; the host refused the connection on this port; could not reach the host on this port | |
| No answer within 5 s; an address that resolves to an internal network (“The endpoint host does not resolve to a public address.”) |
- The health dot is that same check, run every 6 hours and again whenever a search service, cache, media store or judge on the account is saved, or Resume syncing is chosen on a search service or media store.
- The dot shows the endpoint answers, not that data is arriving.
- One failed check turns the dot amber. Three failed checks in a row, counted at most once an hour, turn it red (usually 12–18 h) and raise an Account health issue.
- A failing or degraded destination shows the reason under its name.
- A successful create or edit marks the destination healthy at once.
- Saved headers that can no longer be decrypted turn the dot red: “The saved auth headers can't be read. Edit the destination and enter them again.” The destination can still be viewed, edited and deleted.
What is sent
| Signal | What you get |
|---|---|
| Traces | One trace per API or console request, with outbound calls (embedding, retrieval, rerank, judging) as child spans; each search has an internal search.engine child span tagged provider. Background jobs (imports, feed syncs, evals, watches) send their own traces. |
| Metrics | The metric families below, each tagged with your account. |
| Logs | Log records from your requests and background jobs, linked to their traces. Log text can contain record values and email addresses. |
- Traces and logs of a request on another account's list (as a contributor or shared-list reader) go to no one's destination.
Metric families
Listed in full under Exported metrics. Names start searchstack.; every metric carries account.
| Family | Metrics (kind, unit) | Attributes |
|---|---|---|
| Search | search.duration (histogram, ms), search.requests (counter), search.results.count (histogram), search.zero_results (counter), search.dependency_unavailable (counter) | account, list or group, scope, origin, provider, vector_search, reranker, cache, cache_hit, outcome |
| Cache | cache.hits, cache.misses (counters) | account, repository (list, media_store, model_details): lookups of your list, media-store and model settings. For the search result cache use cache_hit on search.* |
| Embedding | embedding.duration (histogram, ms), embedding.requests, embedding.failures (counters) | account, provider, model, kind (text, image, document, audio, video) |
| Rerank | rerank.duration (histogram, ms), rerank.requests, rerank.failures (counters) | account, provider, model |
| Judge | judge.duration (histogram, ms), judge.requests, judge.failures (counters) | account, provider, model |
| Judge verdicts | judge.verdicts (counter) | account, provider, model, passed |
| Eval | eval.run.pass_rate, eval.run.zero_result_rate (histograms, 0–1), eval.runs, eval.regressions (counters) | account, eval_set, model, reranker, judge, membership_drifted, trigger (Manual, Api, MediaReimport, ModelConverged); eval.runs adds status (completed, failed); the two rate histograms carry status="completed" |
| Watch | watch.sweep.duration (histogram, ms), watch.matches, watch.judge.filtered (counters), watch.precision (histogram, 0–1) | account, watch; watch.sweep.duration has account and outcome only (evaluated, skipped, failed); a check that could not run is skipped |
| Gate | gate.duration (histogram, ms), gate.outcomes, gate.failures (counters), gate.judge.queue_depth (histogram) | account, kind (Builtin, Rules, Judge); gate.outcomes adds outcome (admitted, rejected, quarantined, modified, computed); gate.judge.queue_depth has account only |
| Import | import.rows_read (counter), import.running, import.stalled (gauges) | account |
Search outcome is success, or the reason the search failed:
| Outcome | outcome values |
|---|---|
| Success | success |
| Request refused | validation_failed, InvalidFilter, InvalidOrderBy |
| Not found | AccountDoesNotExist, ListDoesNotExist, ListGroupDoesNotExist, ListVersionDoesNotExist, ListGroupDoesNotContainLists |
| Plan limit | SubscriptionHasExpired, HourlySearchLimitReached |
| Embedding model | ModelIsUnavailable |
| Search engine | throttled: 429, including an attached index's 429 |
| Search engine | engine_error: the search engine refused the query, for example an attached index whose fields changed |
| Search engine | service_unavailable: 5xx, network failure or timeout, or an attached index answering 401, 403 or 404; also counted in search.dependency_unavailable |
| Other | cancelled (the caller went away), exception |
search.*counts every search made through SearchStack: your API and console searches, and the searches your evals, judges, watches and Ask run.origintells them apart:api(your own traffic, the default),eval,watch,judge,ask,probe.- On an attached Azure AI Search index, searches your app sends straight to Azure are not counted. Use Azure’s own metrics for those.
origin="probe"is our own readiness check. It appears only on the account it is pointed at.provideris the search backend key (for examplesearch_stack_v1,azure_attached_v1). It is set only once the search service is resolved.account,listandgroupread(unresolved)until the name is found.accountis lower-case.scopeislistorgroup.vector_search,rerankerandcacheare what the request asked for (defaultsfalse,true,true), not what ran.cache_hit(true/false) appears only when the result cache was used.search.zero_resultscounts successful list and group searches that returned nothing. Zero-result rate of your own traffic =search.zero_results{origin="api"} / search.requests{origin="api",outcome="success"}; withoutorigin="api"it also counts eval, watch, judge and Ask searches.import.runningandimport.stalledare refreshed every 10 minutes. No series, or 0, means none. An account reports its own 0 for one sweep when its imports finish or a stall clears; a reading older than 12 minutes is dropped. In Grafana takemax by (account).- OpenAI embedding calls are counted once, with
account. - A rule pattern that runs out of time adds a
gate.failurespoint withreason="pattern_timeout". - Ratio histograms (pass rate, zero-result rate, watch precision) use 0–1 buckets. Read them with
histogram_quantile. - Series names follow the standard OTLP→Prometheus naming rules.
The search-quality story
The quality metrics — search.zero_results, judge.verdicts, eval.* and watch.precision — carry the eval set, watch or verdict each number came from; search.zero_results carries origin.
- Pass rate fell — alert when the median of
searchstack.eval.run.pass_ratedrops below its recent normal. Theeval.run-regressedwebhook and thesearchstack.eval.regressionscounter use one fixed rule — see Catch a drop. - Zero-result rate spiked — alert when the zero-result rate above rises past your limit (say 2%).
- A watch got noisy — alert when
searchstack.watch.precisionfalls.
Check it works
- Run a search on any list.
- In your backend, look for
searchstack.search.requests{account="<your account>"}. Prometheus-style backends (Grafana) name itsearchstack_search_requests_total. Allow 2–3 minutes after creating the destination. - Metrics unticked (for example Datadog)? Look for a trace with a
search.enginespan instead.
Limits
- Best effort: each batch gets one attempt with a 10 s timeout. A batch your backend refuses is dropped.
- A new or changed destination takes up to ~90 s to start receiving.
- A deleted destination keeps receiving for up to ~90 s.
- Under heavy load, batches can be dropped.
- Destinations are managed in the console only. The API and MCP
account_getlist them read-only, astelemetry_sinksin both SDKs'AccountResponse. - Outbound calls to your endpoints (feeds, webhooks, BYO providers, destination checks) carry trace context but no
baggageheader.
Start from a starter dashboard
Exported metrics → Download starter dashboard builds one from these metrics. These are starters — check every panel in your backend.
- Grafana, New Relic — import the JSON directly in their UIs.
- Datadog — the board charts metrics only. It fills only when they reach Datadog through your own OpenTelemetry Collector or the Datadog Agent (both convert cumulative to delta). With metrics unticked it stays empty.
- Honeycomb — the file is a Boards API request body you POST to
api.honeycomb.io/1/boardswith your own Configuration key. - The Grafana file also has a Search quality row: eval pass rate and zero-result rate per eval set, live zero-result rate (your API traffic only), judge verdict split, eval runs by status, regressions in the window, and watch precision per watch.